
Most investors agree that data is necessary when picking investment assets or cryptos and that good analysis and interpretation can drastically increase returns.
Traders and investors alike have internalized the importance of investing time and effort in analyzing data and converting it into relevant insights that can guide their decision-making process. However, getting the correct data in the first place can be a convoluted process.
A straightforward system that works across different industries and sectors is more critical than ever.
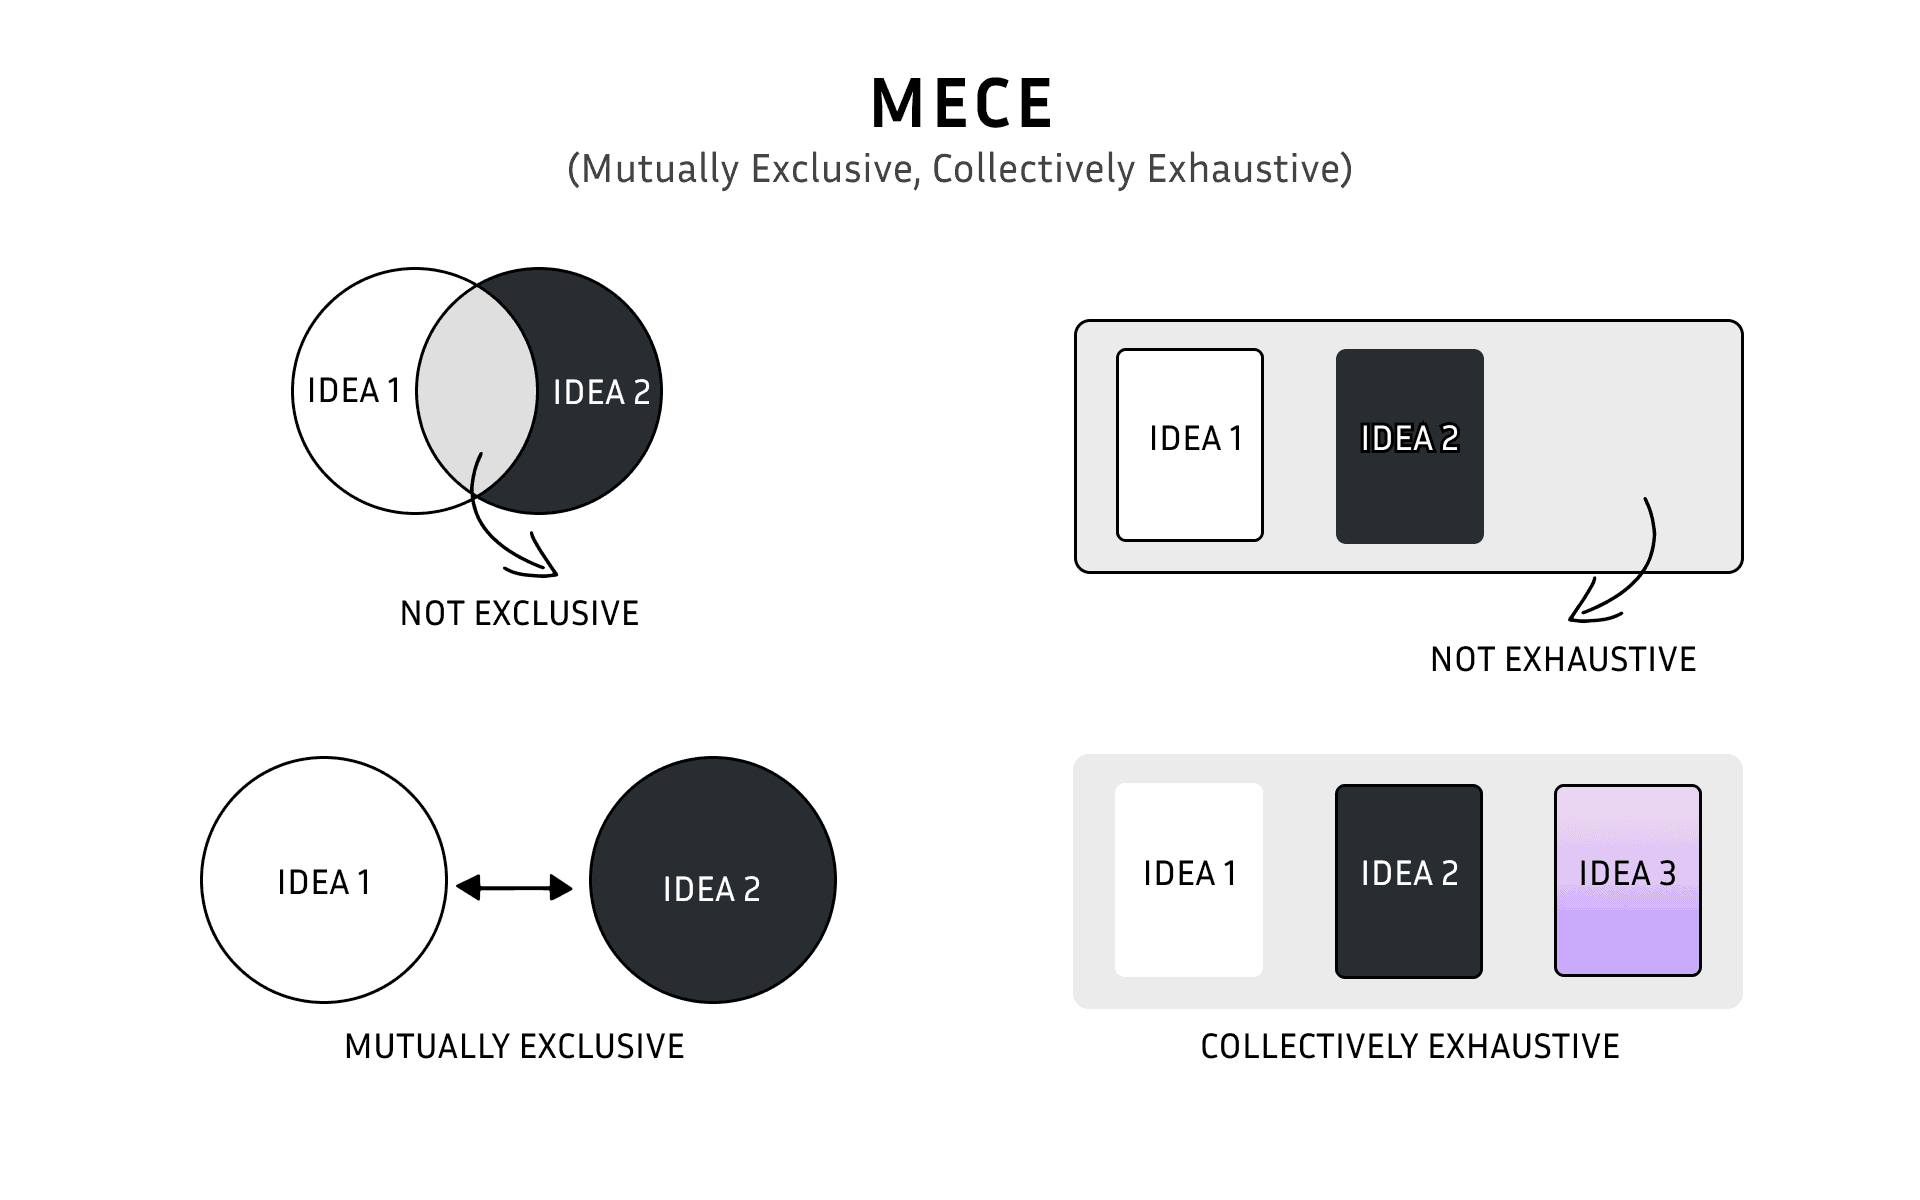
The Arch team has developed an in-house classification standard (Arch classification standard, or ATCS, in short) to fulfill this purpose. It is an exhaustive, objective, rules-based, and flexible measure. Every token into ATCS can be classified using our system and has only one classification (AKA MECE).
In ATCS, every token has two classifications, from an industry perspective and a type perspective. A broader view can be seen in the picture below.
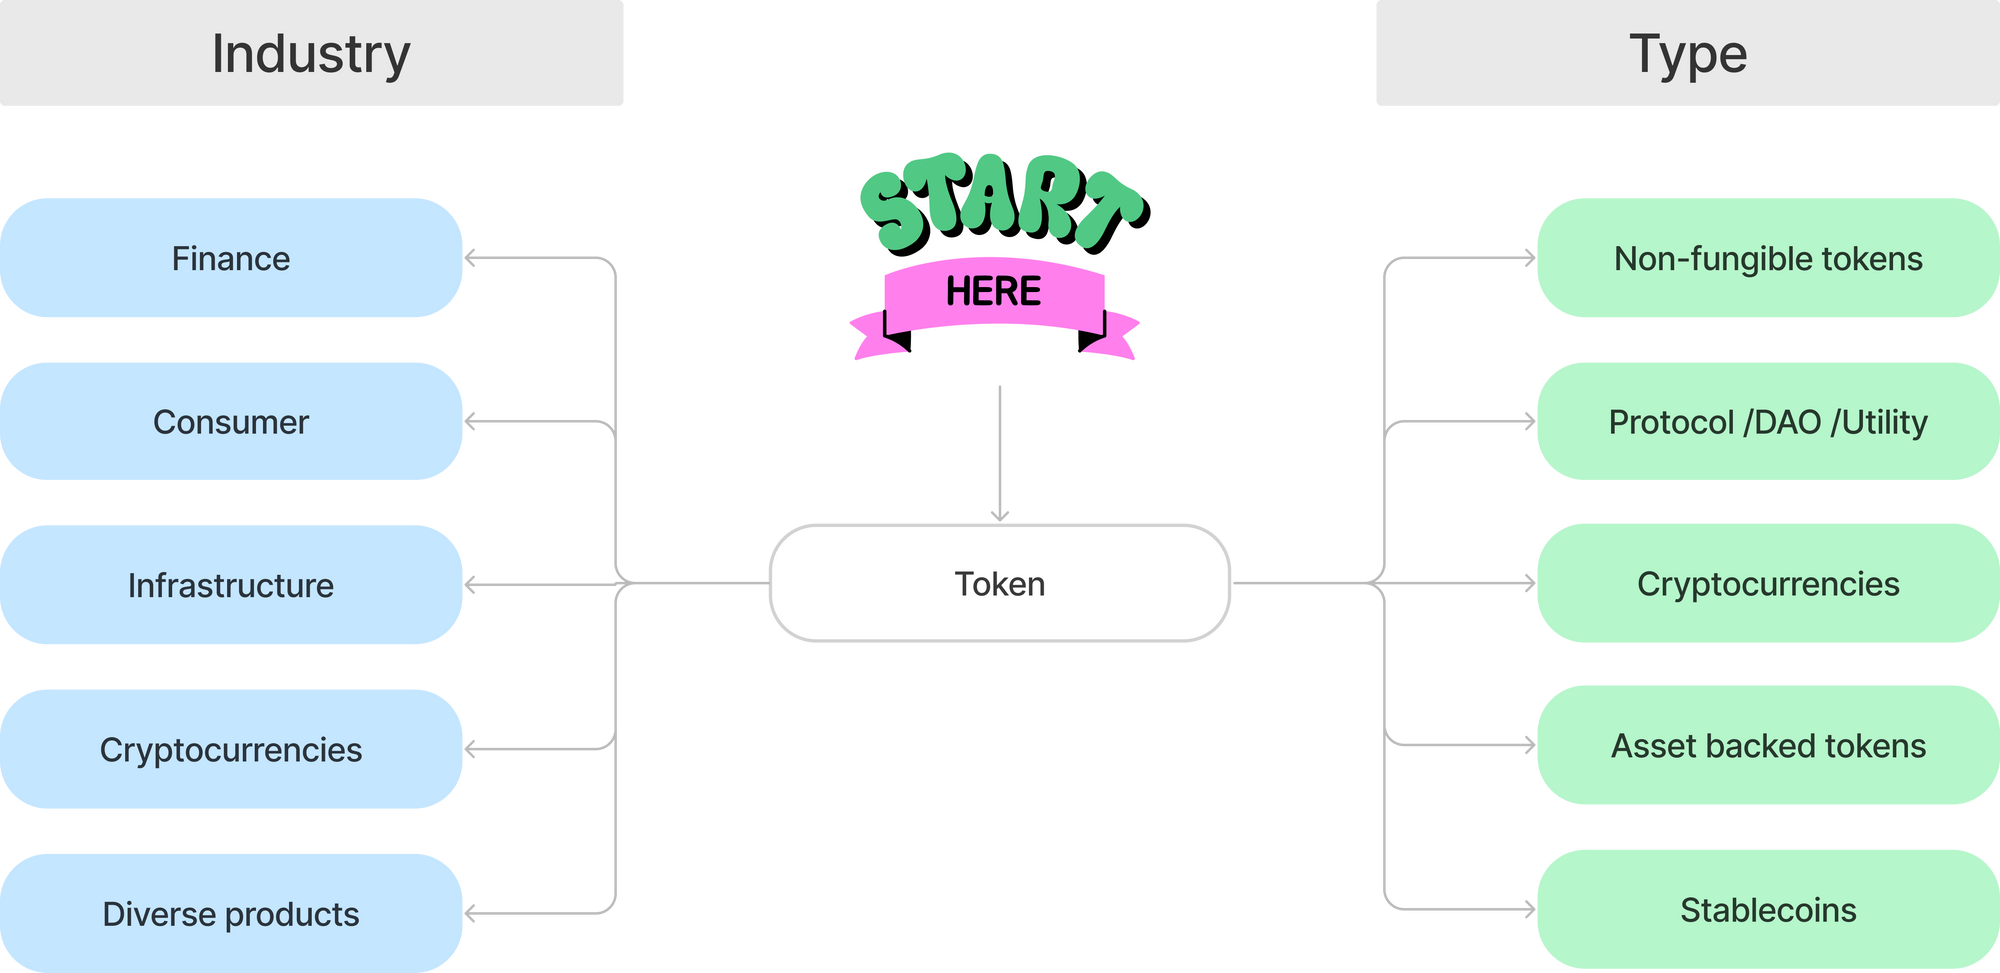
What's the difference between industry and type 🤔 ?
The industry of a token tells us how the protocol to which the token belongs makes money, and the type is its role in the blockchain.
Let's take, for example, LINK (Chainlink). From an industry-type perspective, the LINK token is a protocol/DAO/utility token because it's the protocol's core token. From the industry side, it's an infrastructure token because they make money by being the most used oracle network currently working on Ethereum or an infrastructure solution.
🥱 OK, Cool, but what's the purpose of this ATCS
There are two main reasons why it exists and its importance of it.
The first reason is that ATCS is the starting point of Arch Indices and, therefore, tokens and investable products.
The second reason is to keep track of how the crypto world is evolving and what industries are trending.
Information like that is essential to make better decisions when analyzing new projects or investment opportunities. In other words, it is a critical pillar of our research, and our users will be able to use it too!! 🔜
ATCS in action 🤓
To see how ATCS can be used, we will compare three industry indices from the Ethereum network with the stablecoins indices.
Let's see the below chart. It shows the share (%) of different industries from ATCS since ETH and BTC ATH (Nov. 2021).
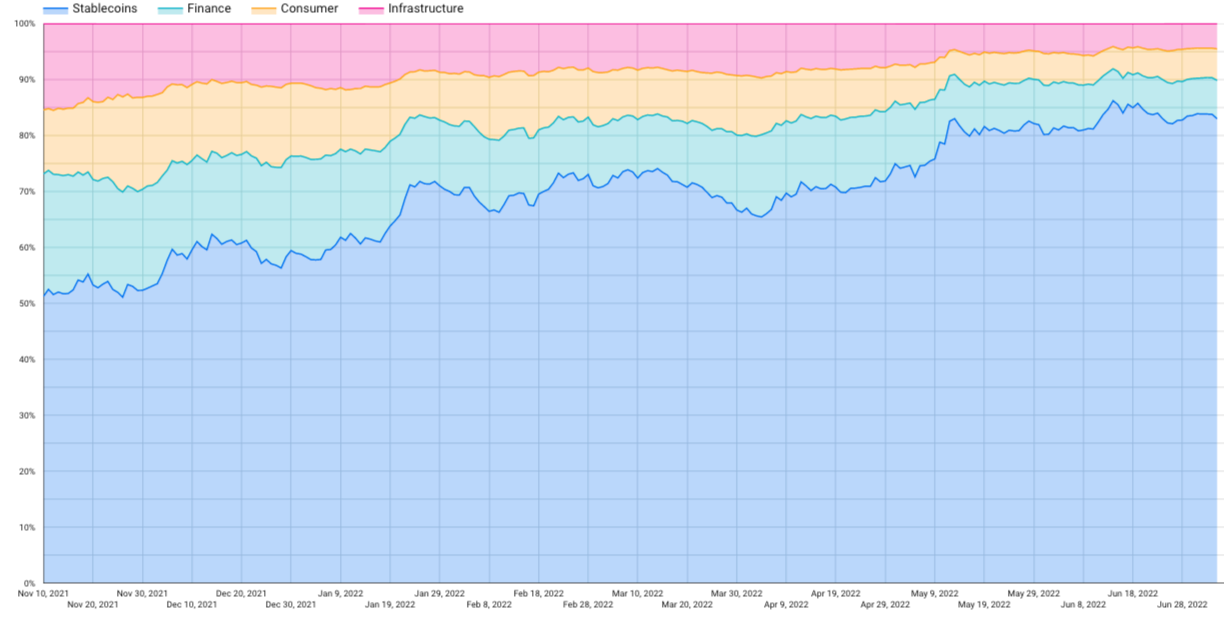
Can we infer something just from this chart?
When bear markets emerge, it's normal to expect money to move to more stable assets, and in crypto, stablecoins are the more "stable" coins (almost every time 😅).
Then we can ask ourselves if a bear market means more stablecoins dominance, a bull market ➡️ less stablecoins dominance? Let's take a look at the following chart.
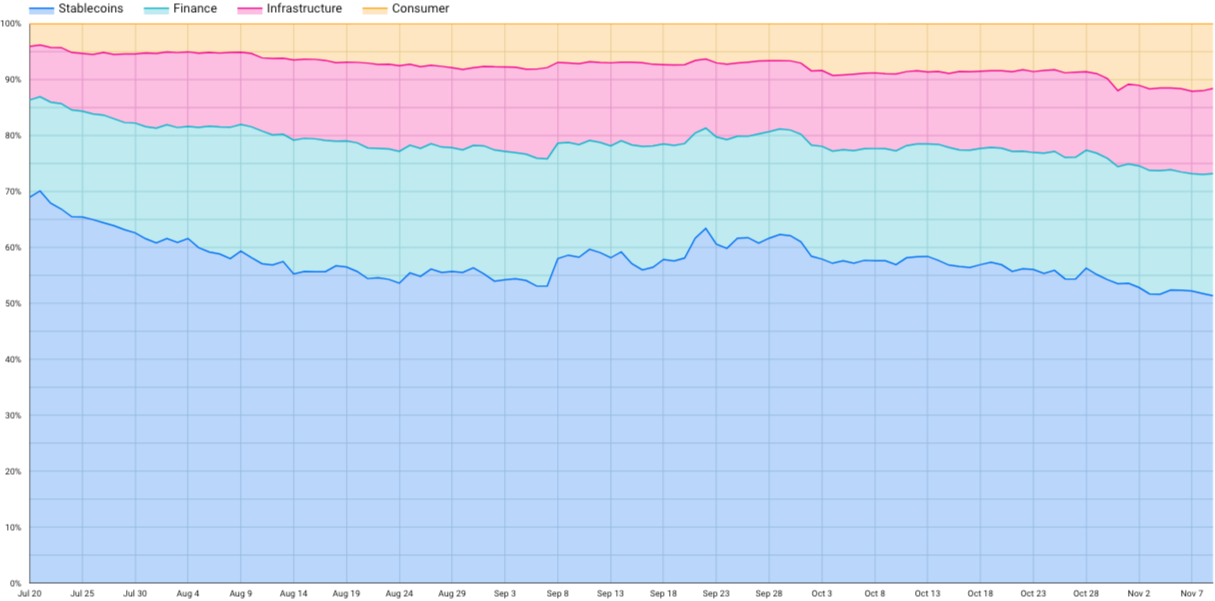
🐂 market 70% stables dominance to 50%.
🐻 market 50% stables dominance to 80%.
The last example is one from a long list of further analyses that can be done thanks to our brand new ATCS. Of course, we must look at it from different perspectives to get a better picture. The following example shows the same information but from a different perspective.
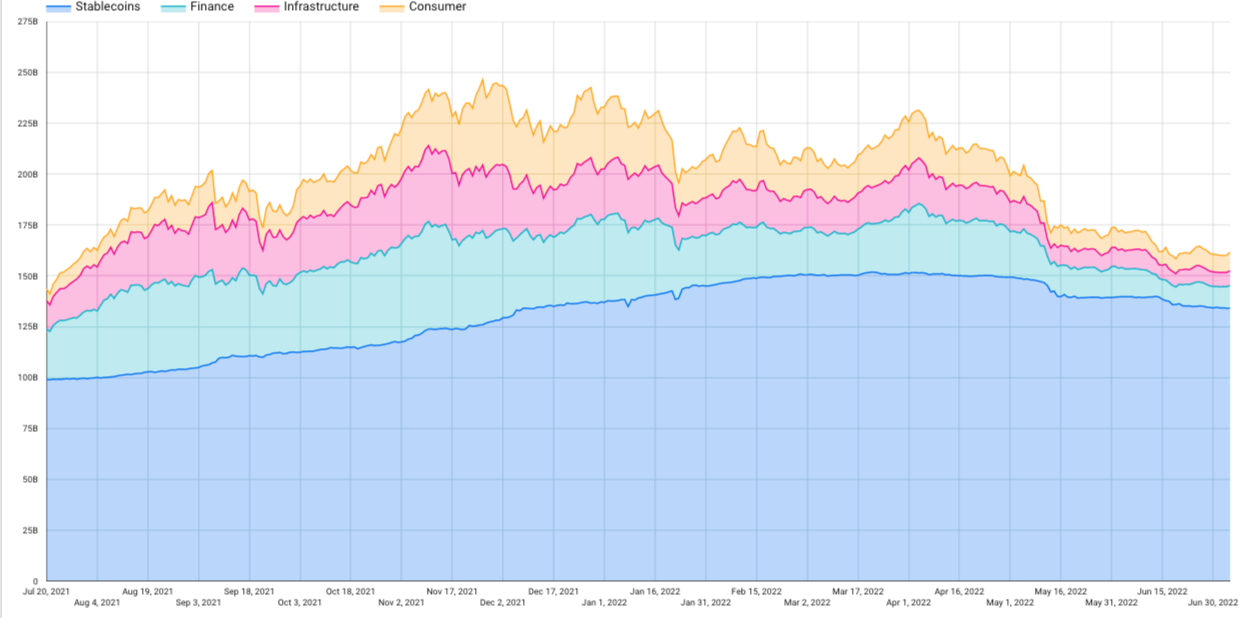
We can see from the chart above that from July 2021 to the ATH, all the industries tracked by the ATCS and stablecoins grew, but some industries grew more when compared to stablecoins.
The chart shows how stablecoins (from ATH) kept winning dominance compared to the other indices. Finally, a momentous event shows up in the graph that couldn't be spotted in the first portion. That's the UST depeg and Luna's crash, a significant event that happened in May and took the whole crypto market down.
Another interesting perspective is to take the stablecoin index out so we can analyze how the different industries performed.
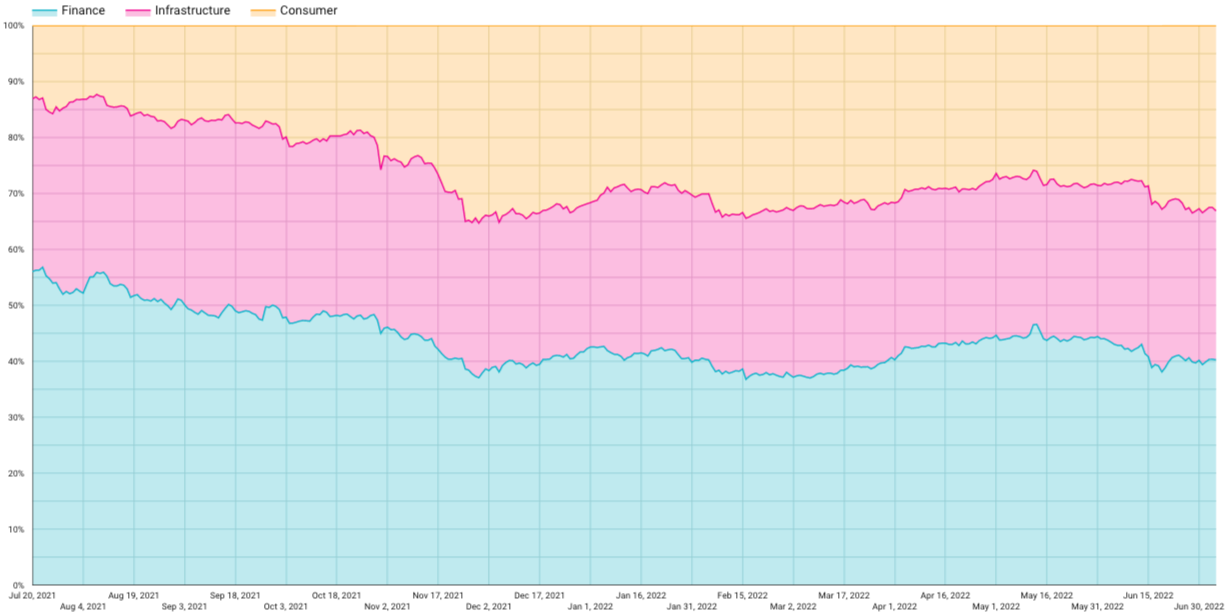
The chart above shows a consumer trend, mostly winning share at finance expenses, can be spotted. This trend can be easily verified because the consumer industry is where the metaverse and entertainment protocols belong.
Research has always been the cornerstone of informed decisions. Having a sound classification system as a baseline, like the ATCS, allows for conducting research and getting better insights in a way that's standard across industries and token types.
Good data is more critical than ever in bear markets — understanding how things are moving and why are vital factors when making data-driven investing decisions.
The indices shown here will be in production and available on our website soon. The ATCS documentation will also be available on our learning center and GitBook so you can conduct your research and investigation.
And keep your eyes open; our newsletter will be packed with more insights using our ATCS.