Our recent Arch Bitcoin Price survey showed that bitcoin's market sentiment is positive, with the average prediction putting bitcoin in the almost $30,000 price mark by the end of the year. The Call-Put skew is positive since early January, in accordance with our survey results.
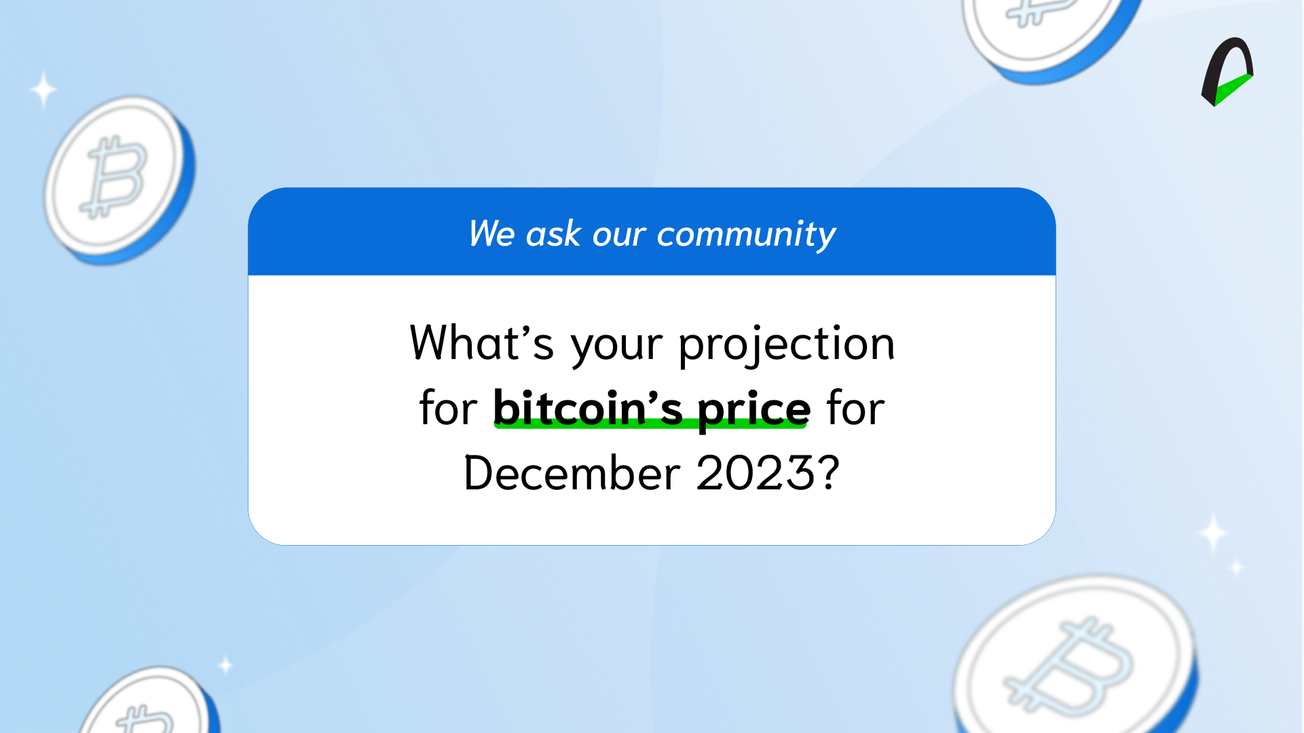
In early January, we surveyed users, asking them to guess bitcoin's price at the end of 2023. In just a few days, we had 92 respondents (thank you guys!) that, on average, had a very constructive view on bitcoin's future price.
Survey respondents include notable experts from the crypto ecosystem and traditional finance, coupled with respondents from social media and our newsletter readers to get a varied pool of users.
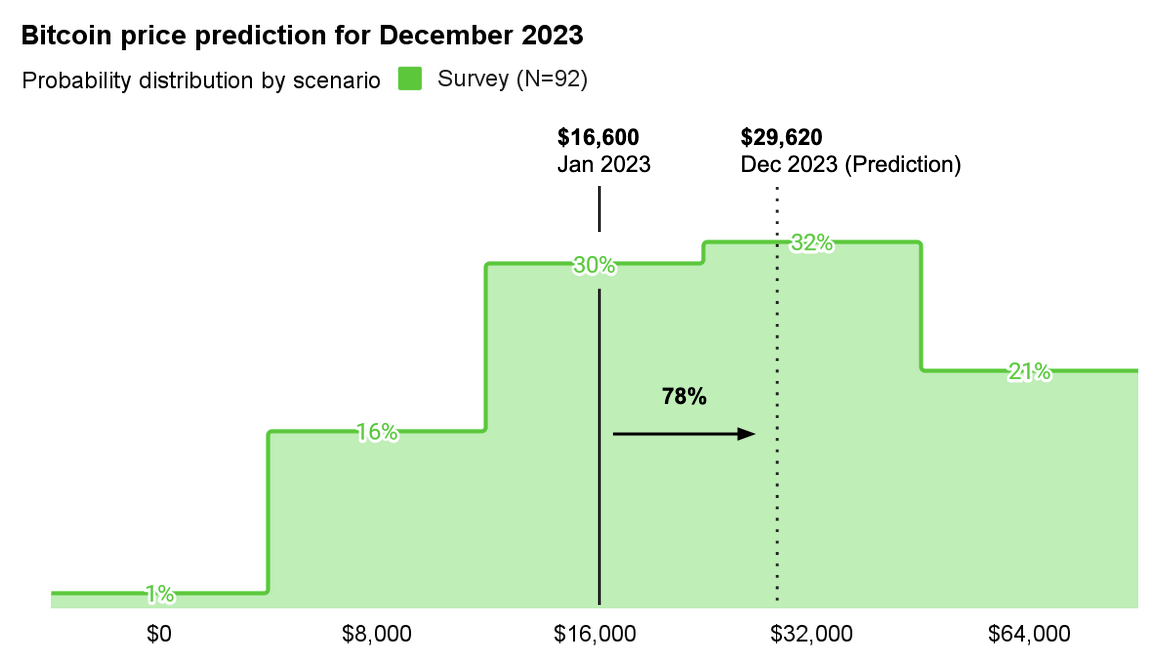
The average bitcoin's price prediction was USD 29,620, a 78% increase from the USD 16,600 market price when we sent the survey.
Interestingly (but not surprisingly), not even one respondent said it should be anywhere close to USD 0 or entirely have a total price fall.
Moreover, only 1 in every six respondents thought it should be under the then-current price of $16,600.
We looked into our results and found that more than 45% of respondents believe bitcoin will end the year with a price over USD 30,000, while 16% predict the price would be over USD 40,000.
Only 5% of participants believe the price could be over the USD 50,000 mark by December this year.
Survey results - either down or up - can't necessarily be considered a scientific forecast - even though we did have a fair number of experts participating - because we are asking a few people to try and predict an asset price based only on their "gut feeling.” But a "gut feeling" can become a sentiment gauge that’s useful for analyzing market trends, especially in the short term. More on that below.
Findings Sustained by Call-put Skew
One of the most valuable and direct ways to measure the market sentiment (if bullish or bearish) is by checking the call-put skew.
The call-put skew tells us if the market sentiment is positive or negative according to the relative demand for calls and puts (as measured by the implied volatility). If the average investor is bullish, they will be more willing to pay more to have an upside in a call.
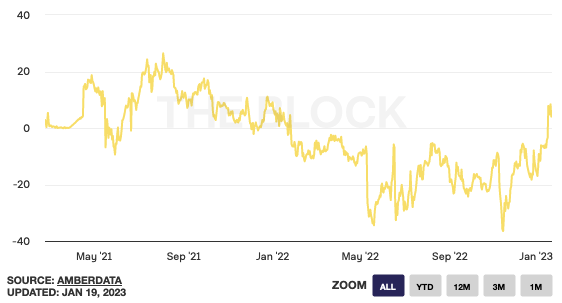
The market is showing a positive sentiment toward bitcoin's future price, which aligns with our survey analysis. The call-put skew turned positive since early January, reflecting higher call demand.
This positive market sentiment was not seen around since the last bull market cycle that ended in December 2021; it's still far from the euphoric days of mid-2021.
It is no surprise that demand for puts was strong during the adverse events of 2022 (Terra-Luna collapse in May and FTX scandal in November) when investors demanded protection to hedge against an increasing contagious risk.
Does it mean bitcoin's price will continue to go up?
Hard to say, of course. Market indicators like the call-put skew and surveys only tell investors how the crowd is positioned. Too many put buyers may signal that the price has reached the bottom (eventually, a good entry point); on the other hand, too many call buyers may indicate that the market is making a top and could revert soon — anything in between shows that the crowd has a no-consensual view.
However, if market sentiment continues in a similar pattern, we might see a price over the USD 30,000 point like our respondents forecast.
And while sentiment analysis can be a valuable tool when investing and deciding when to buy an asset, at Arch, we like to remind investors that “time in the market” often beats trying to “time the market.”
Learn more: What is the Call Parity Skew?
The skew measures the difference between the implied volatility of calls and puts. It can sound complicated, but it is not if we briefly explain the terms:
- A call gives the purchaser the right (but not the obligation) to buy an asset at a predetermined price on or before a specific date.
- A put, conversely, is the right to sell.
- Volatility can be understood as the expectation for a future price to be different (either up or down) from what it currently is.
- Implied volatility is an indirect calculation based on the call or put price. It's higher if the price (demand) of the call or put is higher, and it's lower if demand is lower.
Essentially, calls have higher demand when sentiment is bullish, which translates into higher implied volatility for calls than for puts. Conversely, puts are more demanded when sentiment is bearish, which drives a higher implied volatility for puts than for calls.
Regarding the graph, a positive sentiment means that investors are more likely to position their bets on higher future prices, weighing the graph to the right. Just like the pattern shown in Arch's pool chart.